![[Deprecated]](figures/lifecycle-deprecated.svg)
correctCoordGPS() is deprecated and has been replaced by check_plot_coord().
Please see the vignette Spatialized trees and forest stand metrics with BIOMASS
This function builds the most probable GPS coordinates of the plot corners from multiple GPS measurements.
Usage
correctCoordGPS(
longlat = NULL,
projCoord = NULL,
coordRel,
rangeX,
rangeY,
maxDist = 15,
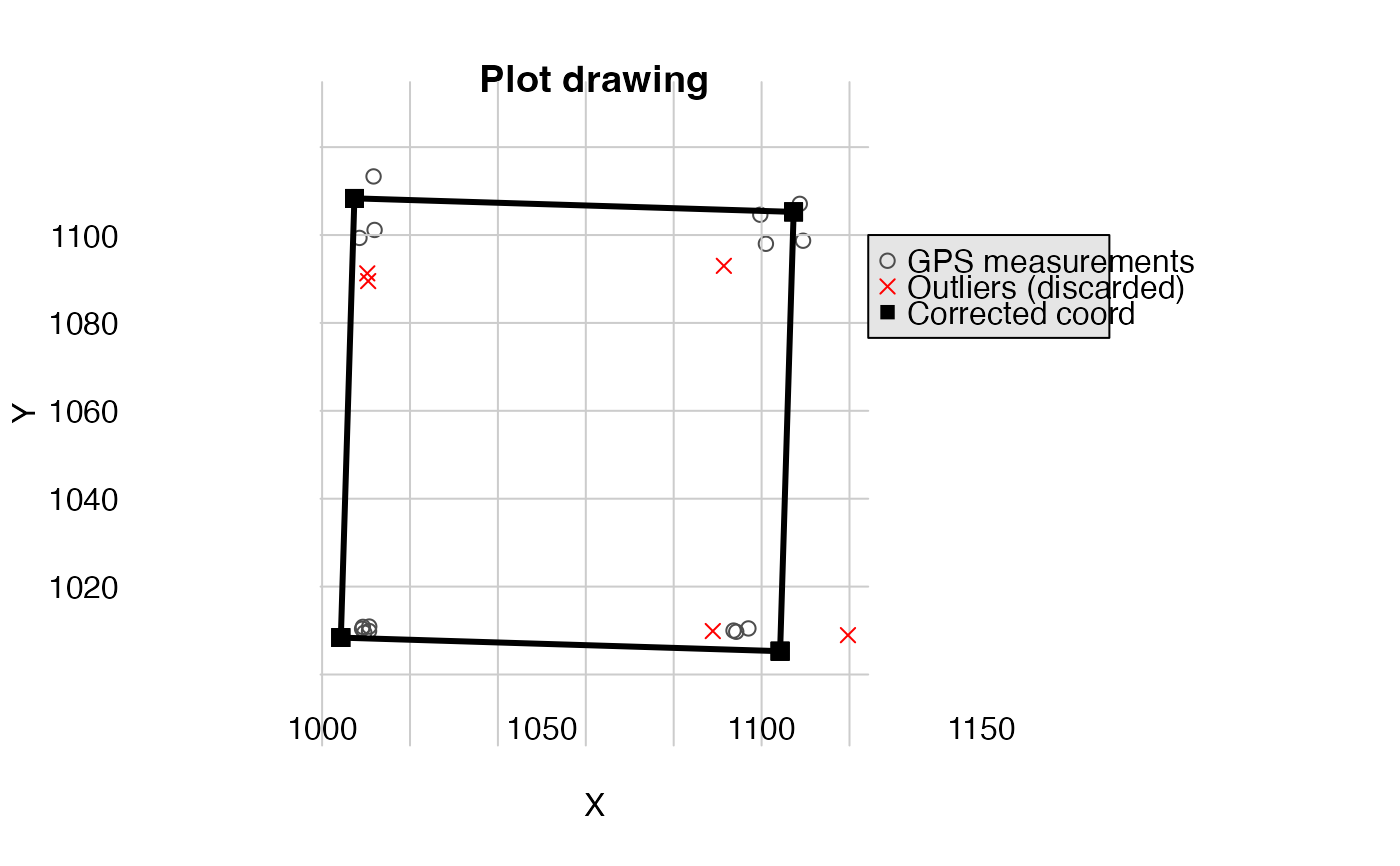
drawPlot = FALSE,
rmOutliers = TRUE
)Arguments
- longlat
(optional) data frame with the coordinate in longitude latitude (eg. cbind(longitude, latitude)).
- projCoord
(optional) data frame with the projected coordinate in X Y
- coordRel
data frame with the relative coordinate in the same order than the longlat or projCoord
- rangeX
a vector of length 2 giving the range for plot relative X coordinates
- rangeY
a vector of length 2 giving the range for plot relative Y coordinates
- maxDist
a numeric giving the maximum distance above which GPS measurements should be considered as outliers (by default 15 m)
- drawPlot
a logical if you want to display a graphical representation
- rmOutliers
a logical if you want to remove the outliers from coordinates calculation
Value
If there are no outliers or rmOutliers = TRUE, a list with:
cornerCoords: a data.frame with the coordinates of the cornerscorrectedCoord: a data.frame with the adjusted coordinates given as inputpolygon: a spatial polygonoutliers: index of coordinates lines considered as outliers, if anycodeUTM: the UTM code of the coordinates if the parameterlonglatis set
Details
GPS coordinates should be either given in longitude latitude (longlat) or in projected coordinates (projCoord)
Examples
projCoord <- data.frame(
  X = c(
    runif(5, min = 9, max = 11), runif(5, min = 8, max = 12),
    runif(5, min = 80, max = 120), runif(5, min = 90, max = 110)
  ),
  Y = c(
    runif(5, min = 9, max = 11), runif(5, min = 80, max = 120),
    runif(5, min = 8, max = 12), runif(5, min = 90, max = 110)
  )
)
projCoord <- projCoord + 1000
coordRel <- data.frame(
  X = c(rep(0, 10), rep(100, 10)),
  Y = c(rep(c(rep(0, 5), rep(100, 5)), 2))
)

aa <- correctCoordGPS(
  projCoord = projCoord, coordRel = coordRel,
  rangeX = c(0, 100), rangeY = c(0, 100)
)
#> Warning: This function still work but will be removed (defunct) and replaced by checkCoordPlot in the next version. Please see VIGNETTENAME? vignette
#> Warning: 'correctCoordGPS()' has been replaced by `check_plot_coord()` function and will be removed in the next version.
#> Please see the vignette `Spatialized trees and forest stand metrics with BIOMASS`
#> Warning: longer object length is not a multiple of shorter object length
#> Warning: longer object length is not a multiple of shorter object length
bb <- correctCoordGPS(
  projCoord = projCoord, coordRel = coordRel,
  rangeX = c(0, 100), rangeY = c(0, 100), rmOutliers = TRUE
)
#> Warning: This function still work but will be removed (defunct) and replaced by checkCoordPlot in the next version. Please see VIGNETTENAME? vignette
#> Warning: 'correctCoordGPS()' has been replaced by `check_plot_coord()` function and will be removed in the next version.
#> Please see the vignette `Spatialized trees and forest stand metrics with BIOMASS`
#> Warning: longer object length is not a multiple of shorter object length
#> Warning: longer object length is not a multiple of shorter object length
#> Warning: calling par(new=TRUE) with no plot
# \donttest{
correctCoordGPS(
  projCoord = projCoord, coordRel = coordRel,
  rangeX = c(0, 100), rangeY = c(0, 100), drawPlot = TRUE
)
#> Warning: This function still work but will be removed (defunct) and replaced by checkCoordPlot in the next version. Please see VIGNETTENAME? vignette
#> Warning: 'correctCoordGPS()' has been replaced by `check_plot_coord()` function and will be removed in the next version.
#> Please see the vignette `Spatialized trees and forest stand metrics with BIOMASS`
#> Warning: longer object length is not a multiple of shorter object length
#> Warning: longer object length is not a multiple of shorter object length
#> $cornerCoords
#>          X        Y
#> 1 1004.220 1006.113
#> 2 1104.195 1008.373
#> 3 1101.935 1108.347
#> 4 1001.960 1106.087
#>
#> $correctedCoord
#>           X        Y
#> 1  1004.220 1006.113
#> 2  1004.220 1006.113
#> 3  1004.220 1006.113
#> 4  1004.220 1006.113
#> 5  1004.220 1006.113
#> 6  1001.960 1106.087
#> 7  1001.960 1106.087
#> 8  1001.960 1106.087
#> 9  1001.960 1106.087
#> 10 1001.960 1106.087
#> 11 1104.195 1008.373
#> 12 1104.195 1008.373
#> 13 1104.195 1008.373
#> 14 1104.195 1008.373
#> 15 1104.195 1008.373
#> 16 1101.935 1108.347
#> 17 1101.935 1108.347
#> 18 1101.935 1108.347
#> 19 1101.935 1108.347
#> 20 1101.935 1108.347
#>
#> $polygon
#> Geometry set for 1 feature
#> Geometry type: POLYGON
#> Dimension:     XY
#> Bounding box:  xmin: 1001.96 ymin: 1006.113 xmax: 1104.195 ymax: 1108.347
#> CRS:           NA
#> POLYGON ((1004.22 1006.113, 1104.195 1008.373, ...
#>
#> $outliers
#> [1]  6  7  9 10 17
#>
# }