The plotTEW() function allows plotting topographic exposure to wind products generated using
the computeTEW() function and stored in SpatRaster objects.
Usage
plotTEW(
  sts,
  rasterProduct,
  dtm = NULL,
  colorPalette = NULL,
  main = NULL,
  xlim = NULL,
  ylim = NULL,
  labels = FALSE,
  by = 8,
  pos = 3,
  legends = "topright",
  fan = FALSE,
  dynamicPlot = FALSE
)
Arguments
- sts
StormsListobject.- rasterProduct
layer name in a
SpatRasterobject. These layers are obtained from thecomputeTEWfunction. The names of the layers follow the terminology:for "Integrated", "TEW1wdMean" or "TEW1wdMax", the name of the storm in capital letters, "TEW1wd" or "TEW" and the name of the statistic separated by underscores (e.g.,"PAM_TEW1wd_Mean", "PAM_TEW1wd_Max", "PAM_TEW_Mean"),
for multiple profiles, the name of the storm in capital letters, "TEW" or "TEW1wd", and the indices of the observation separated by underscores (e.g., "PAM_TEW_18", "PAM_TEW1wd_33", ...).
- dtm
SpatRaster. Digital terrain model used to compute the TEW. If provided, the land/ocean mask is derived from the DTM at its native resolution, giving a much finer coastline than world map polygons.- colorPalette
character vector. The color palette used to plot the raster layer. If
colorPalette=NULL(default setting), the default color palette is used.- main
character. Title of the plot. If
main=NULL(default setting), a default title is generated based on the name of the layer.- xlim
numeric vector. The x limits of the plot.
- ylim
numeric vector. The y limits of the plot.
- labels
logical. Whether (TRUE) or not (FALSE, default setting) to add labels with the name of the storm and the indices and ISO times of the observation.
- by
numeric. If
labels=TRUE, defines the frequency at which labels are plotted. Default value is set to8which corresponds to a 24h (or 48h) time interval between the labelled observations when observations are made every 3 (or 6) hours.- pos
numeric. If
labels=TRUE, defines the position of the labels,1(above the observation),2(on the left),3(below, default setting), and4(on the right).- legends
character. Indicates where to plot the legend,
"topright"(default setting),"topleft","bottomleft","bottomright", or"none"(legend not plotted).- fan
logical. Whether (FALSE, default setting) or (TRUE) to add the range of wind direction along the storm.
- dynamicPlot
logical. Whether (FALSE, default setting) or (TRUE) to plot the data dynamicaly using leaflet library
Examples
# \donttest{
# Creating a stormsDataset
sds <- defStormsDataset()
#> Warning: No basin argument specified. StormR will work as expected
#> but cannot use basin filtering for speed-up when collecting data
#> === Loading data ===
#> Open database... /home/runner/work/_temp/Library/StormR/extdata/test_dataset.nc opened
#> Collecting data ...
#> === DONE ===
# Getting storm track data for tropical cyclone Pam (2015)
pam <- defStormsList(sds = sds, loi = "Vanuatu", names = "PAM")
#> === Storms processing ... ===
#>
#> -> Making buffer: Done
#> -> Searching for PAM storm ...
#> -> Identifying Storms: Done
#> -> Gathering storm(s) ...
#>
#> === DONE with run time 0.4898167 sec ===
#>
#> SUMMARY:
#> (*) LOI: Vanuatu
#> (*) Buffer size: 300 km
#> (*) Number of storms: 1
#> Name - Tropical season - Scale - Number of observation within buffer:
#> PAM - 2015 - 6 - 20
#>
# Getting digital terrain model for PortVilla island
mnt <- terra::rast(system.file("extdata", "test_datadtm.tif", package = "StormR"))
# Plotting topographic exposure to wind (tew) for Pam (2015) near Vanuatu
pam.prof <- spatialBehaviour(pam, product = "Profiles", verbose = 0)
pam.tew <- computeTEW(pam.prof, pam, mnt, verbose = 0)
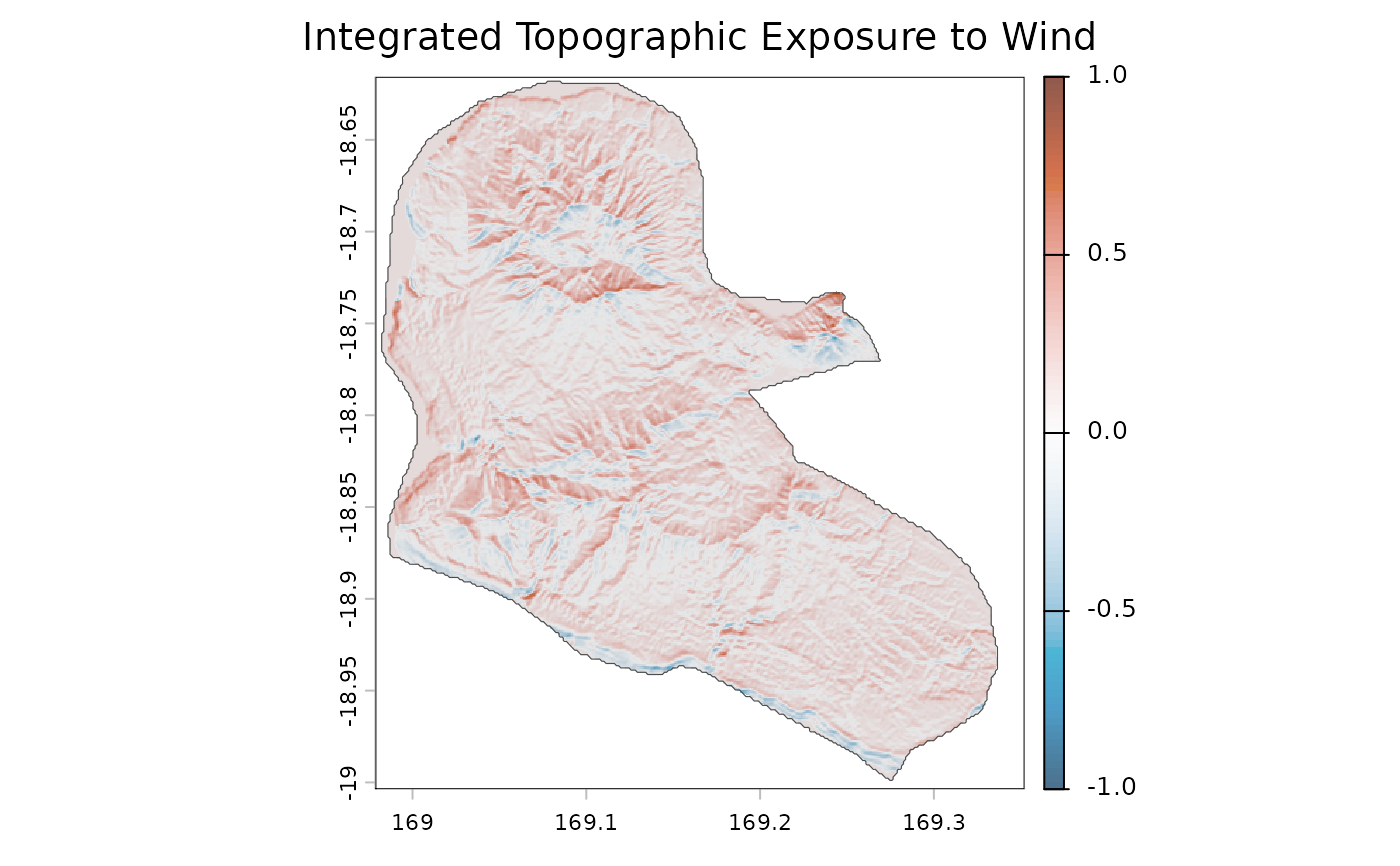
# Basic plot
plotTEW(pam, pam.tew)
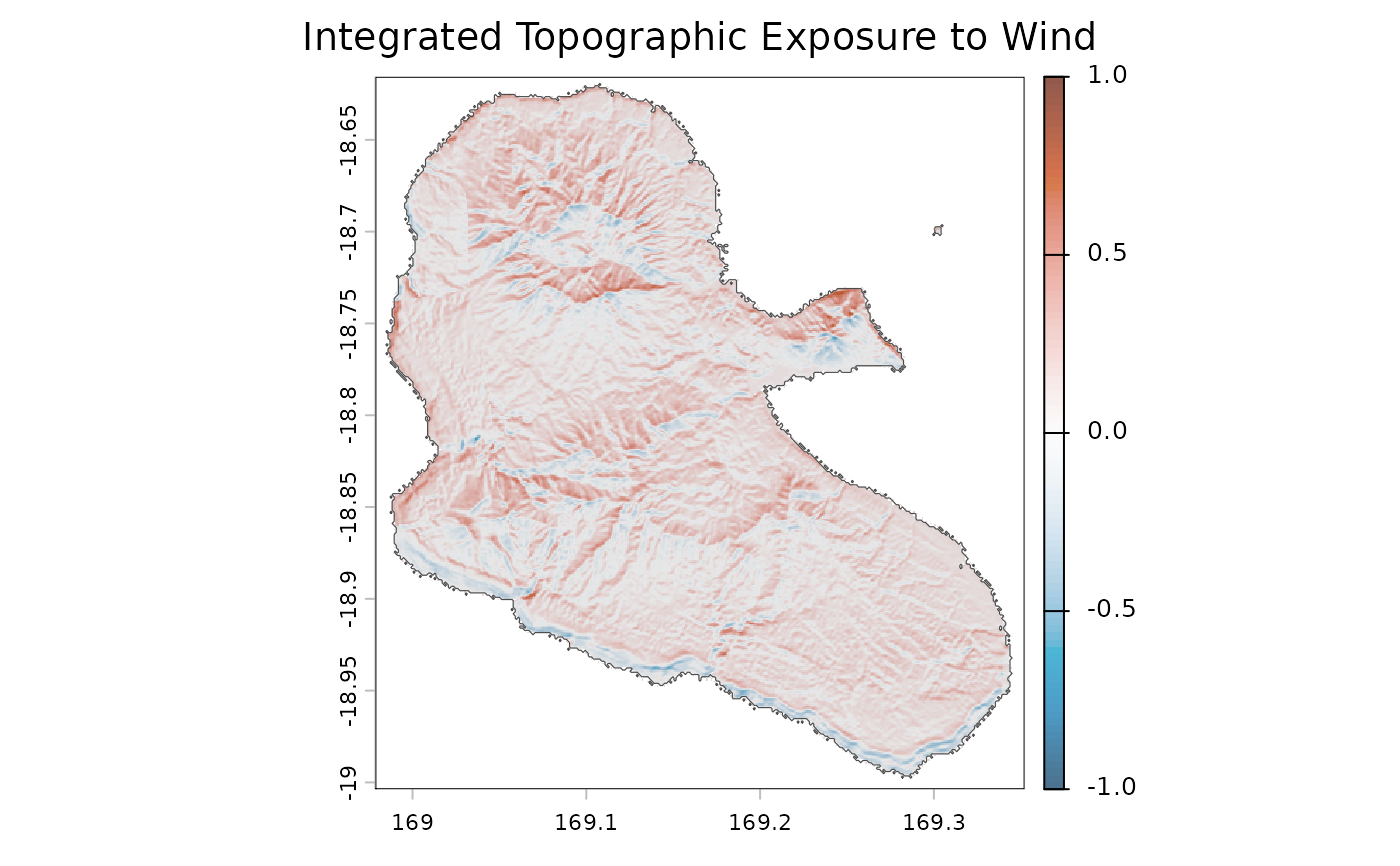
 # Plot with DTM-derived land mask for finer coastline
plotTEW(pam, pam.tew, dtm = mnt)
# Plot with DTM-derived land mask for finer coastline
plotTEW(pam, pam.tew, dtm = mnt)
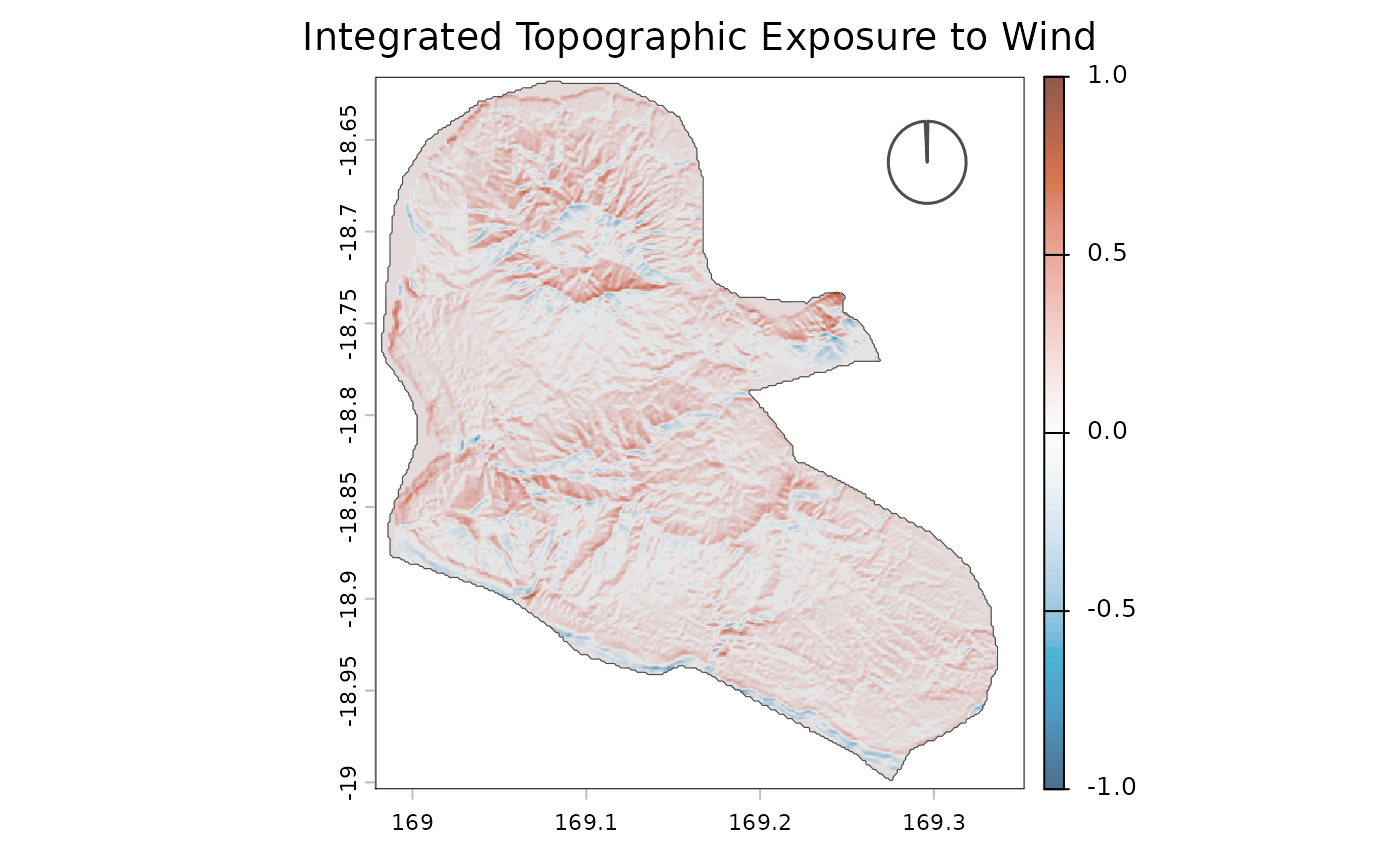
 # Plotting with the range of wind direction
plotTEW(pam, pam.tew, fan = TRUE)
# Plotting with the range of wind direction
plotTEW(pam, pam.tew, fan = TRUE)
 # dynamicPlot mode
plotTEW(pam, pam.tew, dynamicPlot = TRUE)
# }
# dynamicPlot mode
plotTEW(pam, pam.tew, dynamicPlot = TRUE)
# }